Global BRTData

    ABOUT
  BRT
DATA

About Global BRTData

The BRTData gathers information on bus priority systems in cities around the world. The platform is source of research for academics, journalists, students and municipal technicians, as well as provides technical background for decision making regarding public transport.

The data presented contemplate BRT systems (Bus Rapid Transit - median-aligned and segregated bus lanes, pre-board fare collection, and platform-level boarding) and bus priority systems: cities with dedicated bus lanes, but without some of the elements of a BRT. The website allows the user to know the systems and corridors of each city, compare indicators and generate graphs.

The BRTData was developed by BRT+ CoE, a Center of Excellence in BRT, and by WRI, with collaboration of the Institute for Transportation and Development Policy (ITDP). The platform is monthly updated with reliable data and verified by WRI Brasil Ross Center for Sustainable Cities.

    FIND
  YOUR
SYSTEM

BY CITY

    FIND
  YOUR
INDICATOR

SYSTEM

Report

São José dos Campos, Brazil - linha verde


São José dos Campos has 737,310 inhabitants. 26.97% of total trips are made by public transport, as showed in the graph below.


MODAL SPLIT - SãO JOSé DOS CAMPOS

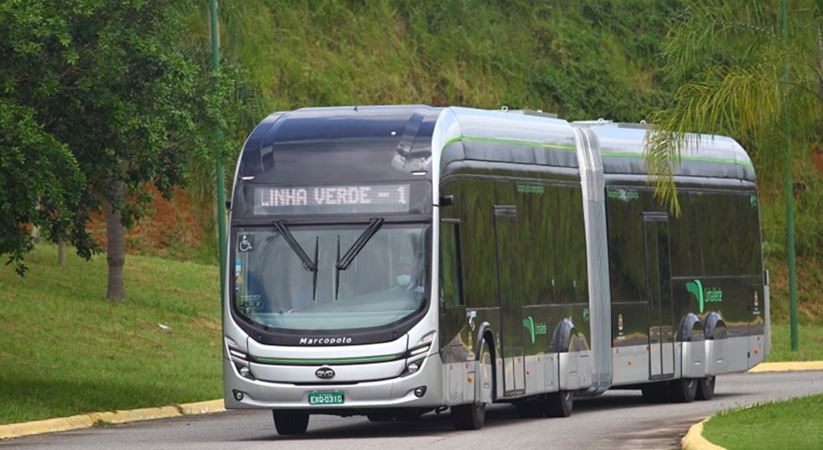
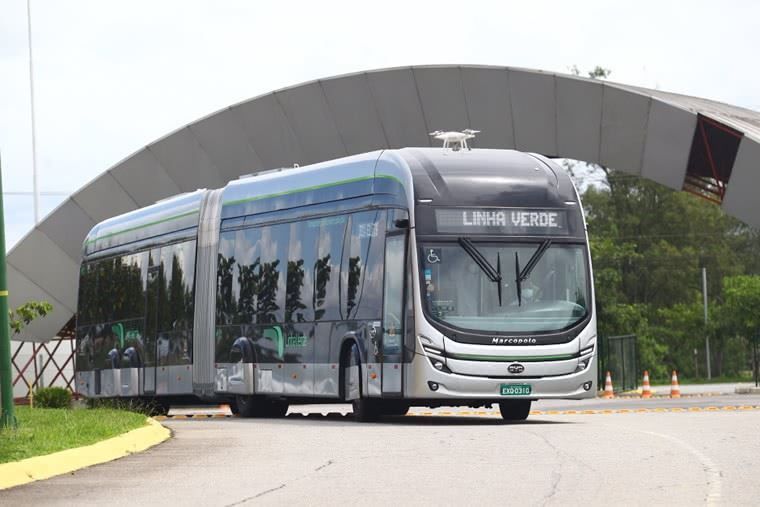
The city has started the system in 2022 and now counts with 1 bus priority corridors consisting of 22 kilometers and benefiting 22,000 passengers every day.


SYSTEM LENGTH IN RELATION TO Brazil


DAILY DEMAND IN RELATION TO Brazil

Some technical details about corridors are presented in the table below.


Corridor NameDaily demand, corridor (passengers per day)Corridor length (km)Stations, corridorPre-board fare collection, corridorOvertaking lanes, corridorStation boarding level, corridorOperating speed, corridor
Linha Verde 22,000 20 13 None

Curiosities

SYSTEM Indicators

Indicator Value Date Source
GDP per capita (US$) (General info) 6796.8 2020 databank.worldbank.org
Population, city (General info) 737,310 2021 cidades.ibge.gov.br
Population, metro area (General info) 2,506,181 2021 rmvpln.pdui.sp.gov.br
Population density, metropolitan area (General info) 154.91 2021 rmvpln.pdui.sp.gov.br
Modal split % public transport (General info) 26.97 2012 2013-2016-indicadores.cidadessustentaveis.org.br
Modal split % private transport (General info) 45.56 2012 2013-2016-indicadores.cidadessustentaveis.org.br
Modal split % non motorized (General info) 26.47 2012 2013-2016-indicadores.cidadessustentaveis.org.br
System name (System info) Linha Verde 2019 www.sjc.sp.gov.br
Corridors (System info) 1 2019 www.sjc.sp.gov.br
Year system commenced (System info) 2022 2022 www.sjc.sp.gov.br
Transit agency (System info) SEMOB 2023 Mobilidade Urbana - Prefeitura de São José dos Campos (sjc.sp.gov.br)
Standard fare (US$) (System info) 0.83 2023 www.sjc.sp.gov.br
Annual fare revenue (US$ millions) (System info) 5.48 2023 Calculated using annual demand and fare
Fare integration within the system (System info)
Citywide fare integration (other modes) (System info)
Integration terminals (System info)
Transfer stations (System info)
Peak load (passengers per hour per direction) (System info)
Daily demand (passengers per day) (System info) 22,000 2020, project demand www.mobilize.org.br
Annual demand (passengers per year) (System info) 6,600,000 2020, project demand Calculated using daily demand and 300 working days
Capital productivity (boardings per bus per day) (System info)
Operational productivity (IPK) (System info)
Operations control center (System info)
Trunk lines (System info)
Feeder routes (System info)
Depots (System info)
System length (km) (Additional Information) 22 2022 mobilidade.estadao.com.br
Position of with-flow lanes (Additional Information) Curbside & Median 2023 Google Maps
Position of counterflow lanes (Additional Information) N/A
Position of bus doors (Additional Information)
Lane material on running ways (Additional Information) Asphalt & Concrete 2023 Google Maps
Lane material at stations (Additional Information)
Stations (Additional Information) 13 2022 www.sjc.sp.gov.br
Station spacing (m) (Additional Information) 1538.5 2022 Calculated using system length and stations
Pre-board fare collection (Additional Information) None 2022 www.sjc.sp.gov.br
Overtaking lanes (Additional Information)
Station boarding level (Additional Information)
Real time information (Additional Information)
Peak frequency (buses per hour) (Additional Information)
Operating speed (Additional Information)
Total fleet (System fleet) 12 2022 www.sjc.sp.gov.br
Fleet, standard buses (System fleet) 0 2022 www.sjc.sp.gov.br
Average age, standard buses (System fleet) N/A
Propulsion, standard buses (System fleet) N/A
Fuel type, standard buses (System fleet) N/A
Fuel economy, standard buses (System fleet) N/A
Fleet, articulated buses (System fleet) 12 2022 www.sjc.sp.gov.br
Average age, articulated buses (System fleet)
Propulsion, articulated buses (System fleet) Electric 2022 www.sjc.sp.gov.br
Fuel type, articulated buses (System fleet)
Fuel economy, articulated buses (System fleet)
Fleet, bi-articulated buses (System fleet) 0
Average age, bi-articulated buses (System fleet) N/A
Propulsion, bi-articulated buses (System fleet) N/A
Fuel type, bi-articulated buses (System fleet) N/A
Fuel economy, bi-articulated buses (System fleet) N/A
Fleet, double-decker buses (System fleet) 0
Average age, double-decker buses (System fleet) N/A
Propulsion, double-decker buses (System fleet) N/A
Fuel type, double-decker buses (System fleet) N/A
Fuel economy, double-decker buses (System fleet) N/A
Typical fuel type (System fleet)
City's diesel sulfur content (ppm) (System fleet)
Total cost per kilometer (US$ million per km) (System cost)
Planning cost (US$ million) (System cost)
Capital cost per kilometer (US$ million per km) (System cost)
Infrastructure cost per kilometer (US$ million per km) (System cost)
Equipment cost (US$ million) (System cost)
Annual operational cost (US$ million) (System cost)
User rating (System image)
Brand and logo (System image) Yes 2022 www.sjc.sp.gov.br
Unique bus livery (System image)
Citywide annual road fatalities (System road safety) 65 2022 painelderesultados.infosiga.sp.gov.br
Citywide annual injuries (System road safety) 2,799 2022 painelderesultados.infosiga.sp.gov.br

CORRIDOR Indicators - Linha Verde

Indicator Value Date Source
Corridor Name (Corridor info) Linha Verde 2022 www.sjc.sp.gov.br
Corridor classification (Corridor info)
BRT Standard (Corridor info)
Year corridor commenced (Corridor info) 2022 2022 g1.globo.com
Corridor service (Corridor info)
Peak load, corridor (passengers per hour per direction) (Corridor info)
Daily demand, corridor (passengers per day) (Corridor info) 22,000 2022 www.mobilize.org.br
Trunk lines, corridor (Corridor info)
Corridor length (km) (Running ways) 20 2022 www.sjc.sp.gov.br
Length of segregated lanes, corridor (km) (Running ways)
Length of segregated counterflow lanes, corridor (km) (Running ways)
Length of exclusive lanes, corridor (km) (Running ways)
Mixed traffic with-flow length, corridor (km) (Running ways)
Position of with-flow lanes, corridor (Running ways) Curbside 2023 Google Maps
Position of counterflow lanes, corridor (Running ways) N/A
Position of bus doors, corridor (Running ways)
Lane material on running ways, corridor (Running ways) Asphalt & Concrete 2022, using recycled tires as pavement mobilidade.estadao.com.br
Lane material at stations, corridor (Running ways) Asphalt & Concrete 2023 Google Maps
Grade-separated intersections, corridor (Traffic engineering)
Fixed signal priority (Traffic engineering)
Dynamic signal priority (Traffic engineering)
Stations, corridor (Stations) 13 2022 www.sjc.sp.gov.br
Station spacing, corridor (m) (Stations) 1538.5 2022 Calculated using corridor length and stations
Enhanced stations (Stations)
Pre-board fare collection, corridor (Stations) None 2022 www.sjc.sp.gov.br
Overtaking lanes, corridor (Stations)
Station boarding level, corridor (Stations)
Type of bus guidance (ITS)
Peak frequency, corridor (buses per hour per direction) (Travel time)
Operating speed, corridor (Travel time)
Express services (Travel time)
Speed limit (km/h) (Travel time)
Real time information, corridor (Comfort)
Physically integrated feeders (Comfort)
Total cost per kilometer, corridor (US$ million per km) (Cost)
Planning cost, corridor (US$ million) (Cost)
Infrastructure cost per kilometer, corridor (US$ million per km) (Cost)
User rating, corridor (Quality of service)
Corridor annual fatalities (Road Safety)

Please, answer the questions below to start your download.

1

2

3

Thank you for answer.

Please, read the information below to start your download.

Thank you for filling out the questions.

If you prefer, you can download a full version of BRT DATA with worldwide data.
Download it here in Excel or CSV.

After you click the download button, your download will start automatically when the conversion process (it can take up to 30 seconds) is complete.